treemind.plot
- treemind.plot.feature_plot(result, col, figsize=(12.0, 8.0), show_std=False, show_range=False, xticks_n=10, yticks_n=10, ticks_fontsize=10.0, title_fontsize=16.0, label_fontsizes=14.0, title=None, xlabel=None, ylabel=None)
Plot a single feature’s contribution profile, handling either
a continuous feature stored as split-point intervals (
<feature>_lb/<feature>_ub), ora categorical feature stored as one identifier column.
The plot shows the mean impact (
value) and can optionally display one or both of±
stdshaded bands, anda count / frequency distribution (kde for continuous, line plot for categorical).
New: Supports multiclass problems. If a ‘class’ column is present, separate plots will be generated for each class.
- Parameters:
result (Result) – The result object containing the feature data.
col (int) – The index of the feature to plot.
figsize ((float, float), default
(12, 8)) – Width × height of the figure (in inches).show_std (bool, default
False) – If True, plot ±stdshaded regions.show_range (bool, default
True) – If True, draw the count / frequency distribution: a KDE curve for continuous data or a line-and-fill plot for categorical data.xticks_n (int, default
10) – Desired number of tick marks on the x- and y-axes respectively.yticks_n (int, default
10) – Desired number of tick marks on the x- and y-axes respectively.ticks_fontsize (float, default
10.0) – Font size for tick labels.title_fontsize (float, default
16.0) – Font size for the plot title (if drawn).label_fontsizes (float, default
14.0) – Font size for x- and y-axis labels and legend text.title (str or None, default
None) – Custom figure title. If None, a title of the form"Contribution of <feature> - Class X"is generated automatically.xlabel (str or None, default
None) – Custom axis labels. If None, they default to the feature name (for x) and"Value"(for y).ylabel (str or None, default
None) – Custom axis labels. If None, they default to the feature name (for x) and"Value"(for y).
- Returns:
The function draws the figure(s) and shows them; nothing is returned.
- Return type:
None
Notes
Continuous data is rendered with a step line (tree-split style). Interval endpoints of ± ∞ are compressed to the outermost finite split so the geometry remains well defined.
Categorical data is rendered with vertical bars originating from zero; categories appear in the order they occur in df.
Multiclass data generates separate plots for each class, with class information appended to the plot title.
Example Usage
Below is an example of how to use the feature_plot function:
from treemind import Explainer
from treemind.plot import feature_plot
# Assume 'model' is a trained tree model
# Create an instance of the Explainer
explainer = Explainer(model)
# Analyze the specified feature by its index
result = explainer.explain(degree=1)
# Plot the feature using a line plot
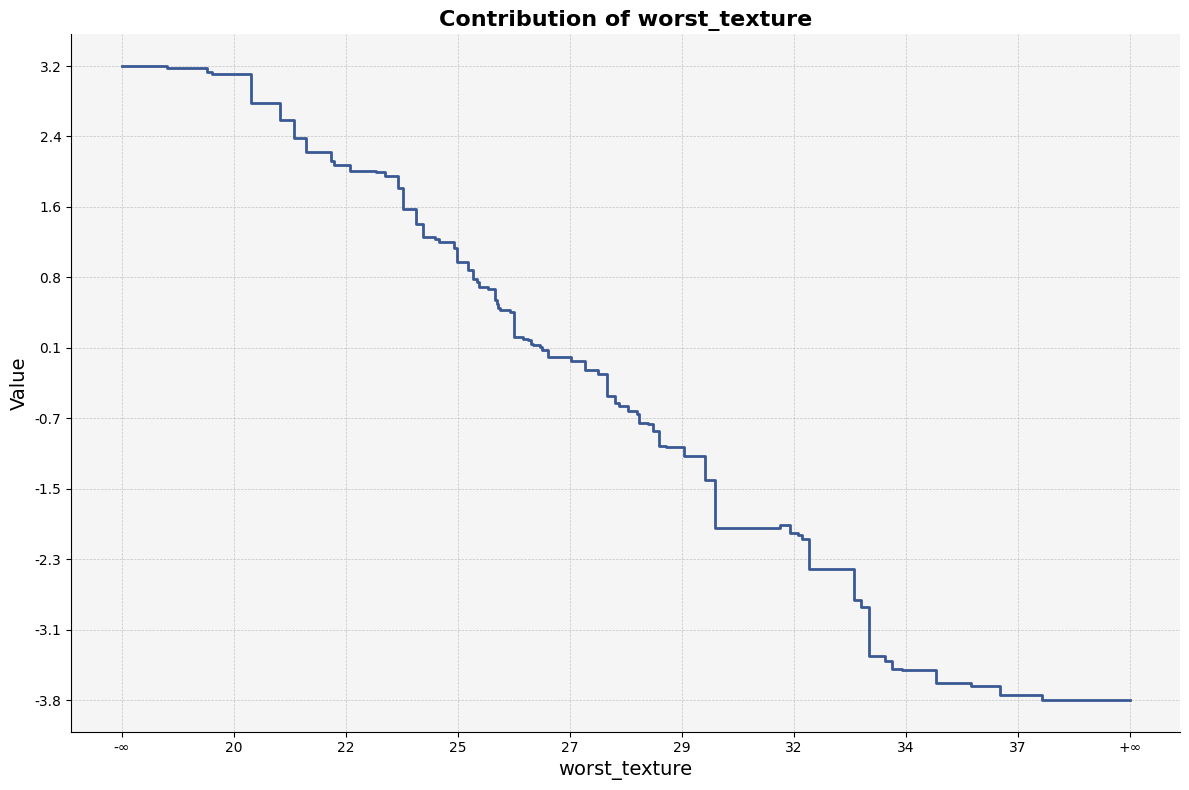
feature_plot(result, 22)
Output
- treemind.plot.interaction_plot(result, cols, figsize=(10.0, 8.0), axis_ticks_n=10, ticks_fontsize=10, title_fontsize=16, label_fontsizes=14, title=None, xlabel=None, ylabel=None, color_bar_label=None)
Plot a heat-map of interaction strengths for two features that may be continuous, categorical, or one of each. If a class column is provided, creates separate plots for each class.
A continuous feature must appear as column pair
<name>_lb+<name>_ub(interval bounds); a categorical feature appears as a single column<name>. The DataFrame must also includevalue(mean impact),std(standard deviation) andcount(bin size).- Parameters:
result (Result) – Result object containing interaction statistics.
cols (tuple of int or list of int) – Indices of the two features to plot.
figsize ((float, float), default (10, 8)) – Width × height of the figure.
axis_ticks_n (int, default 10) – Number of ticks to show on a continuous axis.
ticks_fontsize (float, default 10) – Font size for tick labels.
title_fontsize (float, default 16) – Font size for the title.
label_fontsizes (float, default 14) – Font size for axis- and colour-bar labels.
title (str or None, default None) – Optional figure title.
xlabel (str or None, default None) – Optional axis labels (fall back to feature names).
ylabel (str or None, default None) – Optional axis labels (fall back to feature names).
color_bar_label (str or None, default None) – Label for the colour-bar (“Impact” if None).
class_column (str or None, default None) – Name of the class column. If provided, creates separate plots for each class.
- Returns:
Displays the figure(s).
- Return type:
None
Example Usage
Below is an example of how to use the interaction_plot function:
from treemind import Explainer
from treemind.plot import interaction_plot
# Assume 'model' is a trained tree model
# Create an instance of the Explainer
explainer = Explainer(model)
# Analyze the specified feature by its index
result = explainer.explain(degree=2)
# Plot the feature using a line plot
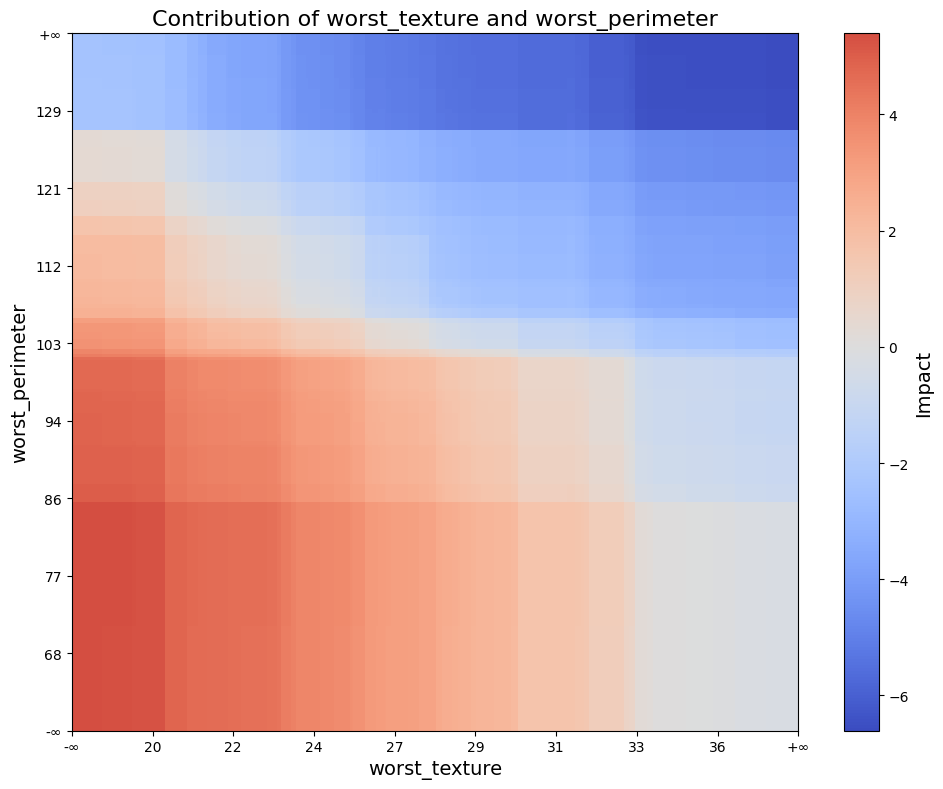
interaction_plot(result, (22, 21))
Output
- treemind.plot.interaction_scatter_plot(X, result, cols, figsize=(10.0, 8.0), ticks_fontsize=10.0, title_fontsize=16.0, label_fontsizes=14.0, title=None, xlabel=None, ylabel=None, color_bar_label=None)
Creates a scatter plot of feature values with colors representing interaction values. If ‘class’ column exists in df, creates separate plots for each class.
- Parameters:
X (pd.DataFrame) – Input data containing feature values
result (Result) – Result object containing interaction statistics.
cols (tuple of int or list of int) – Indices of the two features to plot.
figsize (tuple of float, default (10.0, 8.0)) – Width and height of the plot in inches.
ticks_fontsize (float, default 10.0) – Font size for axis tick labels,
title_fontsize (float, default 16.) – Font size for plot title, by
title (str, optional, default None) – The title displayed at the top of the plot. If None, no title is shown.
xlabel (str, optional, default None) – Label for the x-axis. If None, it will default to the feature name.
ylabel (str, optional, default None) – Label for the y-axis. If None, it will default to the feature name.
color_bar_label (str, optional, default None) – Colorbar label, If None, it will default to “Impact”.
label_fontsizes (float)
- Return type:
None
Example Usage
Below is an example of how to use the interaction_scatter_plot function:
from treemind import Explainer
from treemind.plot import interaction_scatter_plot

# Assume 'model' is a trained tree model

# Create an instance of the Explainer
explainer = Explainer(model)

# Analyze the specified feature by its index
result = explainer.explain(degree=2)

# Plot the feature using a line plot
interaction_scatter_plot(X, result, (22, 21))
Output

- treemind.plot.importance_plot(result, combine_classes=False, figsize=(10.0, 6.0), ticks_fontsize=10.0, title_fontsize=16.0, label_fontsize=14.0, cmap='Reds', *, title=None)
Visualise feature-importance scores with the same visual style as
interaction_plotandfeature_plot.- Parameters:
result (Result) – The result object containing the feature importance data.
combine_classes (bool, default False) – If True, combines class-wise importances into a single DataFrame. Only applicable for multi-class models.
figsize ((float, float), default
(10, 6)) – Figure size in inches.ticks_fontsize (float) – Font sizes for ticks, title and axis/legend labels.
title_fontsize (float) – Font sizes for ticks, title and axis/legend labels.
label_fontsize (float) – Font sizes for ticks, title and axis/legend labels.
cmap (str, default
"coolwarm") – Diverging colour-map centred at zero for the heat-map.title (str or None) – Custom figure title (string is prepended with class info when multiclass). If None, an automatic title is generated.
- Return type:
None
Example Usage
Below is an example of how to use the importance_plot function:
from treemind import Explainer
from treemind.plot import importance_plot

# Assume 'model' is a trained tree model

# Create an instance of the Explainer
explainer = Explainer(model)

# Analyze the specified feature by its index
result = explainer.explain(degree=1)

# Plot the feature using a line plot
importance_plot(result)
Output